• Home
  • About The Herald
  • Local Agencies
  • Daily Email Update
  • Legal Notices
  • Classified Ads

Contra Costa Herald

News Of By and For The People of Contra Costa County, California

  • Arts & Entertainment
  • Business
  • Community
  • Crime
  • Dining
  • Education
  • Faith
  • Health
  • News
  • Politics & Elections
  • Real Estate

State Workforce Board announces $5.7 Million to build career pathways in quantum and fusion

October 26, 2026 By Publisher Leave a Comment

Five projects will connect Californians to training and quality jobs in two emerging industries including at two Bay Area sites

By Anna Champe, Communications Manager, California Workforce Development Board

SACRAMENTO, CA – The California Workforce Development Board (CWDB) today announced $5,744,665 million in Workforce Accelerator Fund (WAF) 14 awards to five projects that will help Californians prepare for and access quality jobs in the state’s growing quantum and fusion industries.

The awards build on Governor Newsom’s recent announcement of new investments and legislation to advance California’s leadership in quantum technology and fusion energy. Quantum and fusion are priority sectors identified in California’s State Economic Blueprint, underscoring the need to support a skilled workforce to drive these emerging industries.

“Expanding on recent state investments in quantum, WAF 14 gives regions across the state an opportunity to prepare workers for these emerging industries,” said Kaina Pereira, Executive Director of the California Workforce Development Board. “By bringing together employers, educators, and workforce partners, these investments will help address key barriers to growth, strengthen California’s workforce, and create new opportunities for Californians.”

The Workforce Accelerator Fund has awarded more than $40 million since 2018 to support partnerships that test, scale, and replicate innovative approaches to workforce development. WAF 14 continues this investment by advancing career pathways in quantum, fusion, and related occupations, connecting Californians to industry-recognized credentials, training, and jobs, including those that do not require a four-year degree.

“Accelerator funds are the first grant I’ve ever worked with that allowed us to try out different solutions and figure out what works best for our individuals,” said Marni Roosevelt, WAF 9 grantee and Director of the Family Resource Center at Los Angeles Valley College.

Watch their success story to learn how WAF helps organizations expand services and create opportunities for Californians facing barriers to employment.

Accelerator 14 Awards

  • $1.5 M for San Jose State University Research Foundation, Quantum Computing Hardware Design – creates a three-tier certificate program that prepares students and workers for careers in quantum computing hardware. The program offers flexible pathways from high school through university, with options to enter the workforce or advance to the next certificate level.
  • $1.03 M for University of California, Berkeley, Northern California Quantum Training Pipeline – Develops and pilots a regional quantum workforce pipeline from grades 9 through 16, connecting students and job seekers to quantum careers. The project will create an implementation plan for coordinated training at the associate and bachelor’s levels, along with an 8- to 13-week industry-verified credential.
  • $993,900 for University of California, Santa Barbara, Q-COAST – establishes a training pathway for hardware technician careers that does not require a four-year degree. The program will prepare workers for jobs in superconductivity, photonic integrated circuits, quantum optics, and fusion.
  • $746,040 for Valley Vision, Inc., Quantum Capital – creates a regional workforce system for Greater Sacramento by defining the quantum economy and skills needed, aligning training and credentials with employer needs, and connecting K-12 education through college to quantum careers.
  • $1.48 M for University of California, San Diego, Fusion CAL Career Pathway – creates a career pathway from high school through college and university to in-demand fusion jobs. Serving an estimated 160 participants, the pathway includes a stackable, industry-recognized certificate that can be earned in 13 weeks.

Since 2019, CWDB has awarded more than $596 million to support workforce development projects across the state, serving more than 80,500 participants. Grounded in equity, quality jobs, and climate resilience, these investments help Californians with employment challenges, access supportive services, develop in-demand skills, earn industry-recognized credentials, and connect to quality jobs that offer opportunities for long-term career growth.

About CWDB

The California Workforce Development Board forges partnerships with businesses, labor, and government to build an economy defined by equity, quality jobs, and climate resiliency that challenges systemic barriers toward shared economic prosperity.

 

Filed Under: Education, Finances, News, State of California, Technology

46 Contra Costa County schools, 6 districts named to 2026 California Honor Roll 

October 23, 2026 By Publisher Leave a Comment

Source: Educational Results Partnership

By Marcus Walton, Director, Communications and Special Projects, Contra Costa County Office of Education

PLEASANT HILL, Calif.— Forty-six schools and six school districts in Contra Costa County have been named to the 2026 California Honor Roll, a recognition presented by Educational Results Partnership (ERP) and the Campaign for Business and Education Excellence.

The recognition highlights schools and districts that are demonstrating strong student achievement, making measurable progress in closing achievement gaps among historically underserved student groups, and improving outcomes for all students. Among the 2,080 schools and 168 districts recognized statewide, Contra Costa County schools and districts continue to stand out for their commitment to student success.

“It is meaningful to see the business community recognize the outstanding work taking place in our schools and districts,” Contra Costa County Superintendent of Schools Lynn Mackey said. “This distinction highlights how public education in Contra Costa County is preparing students to be future ready with the knowledge, skills, and opportunities they need to thrive in college, careers and their communities.”

The six Contra Costa County school districts named to the 2026 California Honor Roll are: Acalanes Union High School District, Brentwood Union School District, Lafayette Elementary School District, Moraga Elementary School District, Orinda Union School District, and San Ramon Valley Unified School District.

The following 46 schools in the county were also honored: 

  • Campolindo High School — Acalanes Union High School District
  • Miramonte High School — Acalanes Union High School District
  • Adams (J. Douglas) Middle School — Brentwood Union School District
  • Edna Hill Middle School — Brentwood Union School District
  • Garin Elementary School — Brentwood Union School District
  • Isaac R. Montañez Elementary School — Brentwood Union School District
  • R. Paul Krey Elementary School — Brentwood Union School District
  • Ron Nunn Elementary School — Brentwood Union School District
  • Discovery Bay Elementary School — Byron Union Elementary School District
  • Burton Valley Elementary School — Lafayette Elementary School District
  • Happy Valley Elementary School — Lafayette Elementary School District
  • Lafayette Elementary School — Lafayette Elementary School District
  • M. H. Stanley Middle School — Lafayette Elementary School District
  • Springhill Elementary School — Lafayette Elementary School District
  • Heritage High School — Liberty Union High School District
  • Martinez Junior High School — Martinez Unified School District
  • Donald L. Rheem Elementary School — Moraga Elementary School District
  • Joaquin Moraga Intermediate School — Moraga Elementary School District
  • College Park High School — Mt. Diablo Unified School District
  • Hidden Valley Elementary School — Mt. Diablo Unified School District
  • Monte Gardens Elementary School — Mt. Diablo Unified School District
  • Pleasant Hill Middle School — Mt. Diablo Unified School District
  • Rocketship Futuro Academy — Rocketship Public Schools
  • Sequoia Middle School — Mt. Diablo Unified School District
  • Walnut Acres Elementary School — Mt. Diablo Unified School District
  • Del Rey Elementary School — Orinda Union School District
  • Glorietta Elementary School — Orinda Union School District
  • Orinda Intermediate School — Orinda Union School District
  • Sleepy Hollow Elementary School — Orinda Union School District
  • Wagner Ranch Elementary School — Orinda Union School District
  • Alamo Elementary School — San Ramon Valley Unified School District
  • Bollinger Canyon Elementary School — San Ramon Valley Unified School District
  • Coyote Creek Elementary School — San Ramon Valley Unified School District
  • Creekside Elementary School — San Ramon Valley Unified School District
  • Diablo Vista Middle School — San Ramon Valley Unified School District
  • Golden View Elementary School — San Ramon Valley Unified School District
  • Hidden Hills Elementary School — San Ramon Valley Unified School District
  • John Baldwin Elementary School — San Ramon Valley Unified School District
  • Pine Valley Middle School — San Ramon Valley Unified School District
  • Rancho Romero Elementary School — San Ramon Valley Unified School District
  • Sycamore Valley Elementary School — San Ramon Valley Unified School District
  • Tassajara Hills Elementary School — San Ramon Valley Unified School District
  • Tice Creek School — Walnut Creek School District
  • Middle College High School — West Contra Costa Unified School District
  • Richmond College Preparatory School — West Contra Costa Unified School District
  • West County Mandarin School — West Contra Costa Unified School District

Now in its 12th year, the California Honor Roll uses California Assessment of Student Performance and Progress (CAASPP) results from 2024-26 to recognize schools and districts that are driving academic growth and improving student outcomes. The honor highlights educational communities that help students build the foundational skills needed for college, career, and life.

According to ERP, the Honor Roll identifies schools that are helping students build the foundational skills needed for college, career and life. ERP partners with business leaders and chambers of commerce throughout California to recognize schools and districts making measurable progress in student achievement. The Honor Roll is the only school recognition program presented in partnership with business leaders and based solely on student achievement outcomes.

To view the full list of California Honor Roll schools and districts, visit www.honorrollschools.com.

About Educational Results Partnership 

Educational Results Partnership (ERP) is a nonprofit organization that applies data science and predictive analytics to identify successful public education systems, practices, programs, and policies that deliver the best results for students. ERP has accumulated the nation’s largest database on student achievement from kindergarten into the labor market. In partnership with educators and employers, ERP charts the pathways that lead to academic success and living-wage jobs. ERP’s goal is to ensure that more students are equipped to enter the workforce with the skills today’s global economy demands. For more information visit: edresults.org.

About Campaign for Business and Education Excellence 

The Campaign for Business and Education Excellence (CBEE) aims to improve economic mobility for the next generation of learners by matching talent to jobs and career opportunities. Aligning academic achievements with job market needs, the campaign engages employers while helping learners pursue careers matched to their existing skills and abilities. Learners across the United States can discover how their education opens doors to immediate career opportunities. For more information visit: edcampaign.org.

About Contra Costa County Office of Education

One of 58 counties in California, Contra Costa County has the 11th largest public-school student population in the state (approximately 169,225 students). Officially established in 1932, CCCOE has a long history of providing direct services to some of the county’s most vulnerable students, including young people who are incarcerated, homeless, or in foster care, as well as students who have severe physical or emotional challenges.

CCCOE also provides support services to schools and school districts in Contra Costa County; services that can be handled most effectively and economically on a regional basis rather than by each of the county’s 286 schools or 18 school districts. These services range from budget approval and fiscal support to technology infrastructure, communication support, and high-level professional development opportunities for educators. CCCOE maintains a website at www.cocoschools.org.

Filed Under: Education, Honors & Awards, News, State of California

Education champion marks 10 years of expanding opportunities for Richmond students

October 23, 2026 By Publisher Leave a Comment

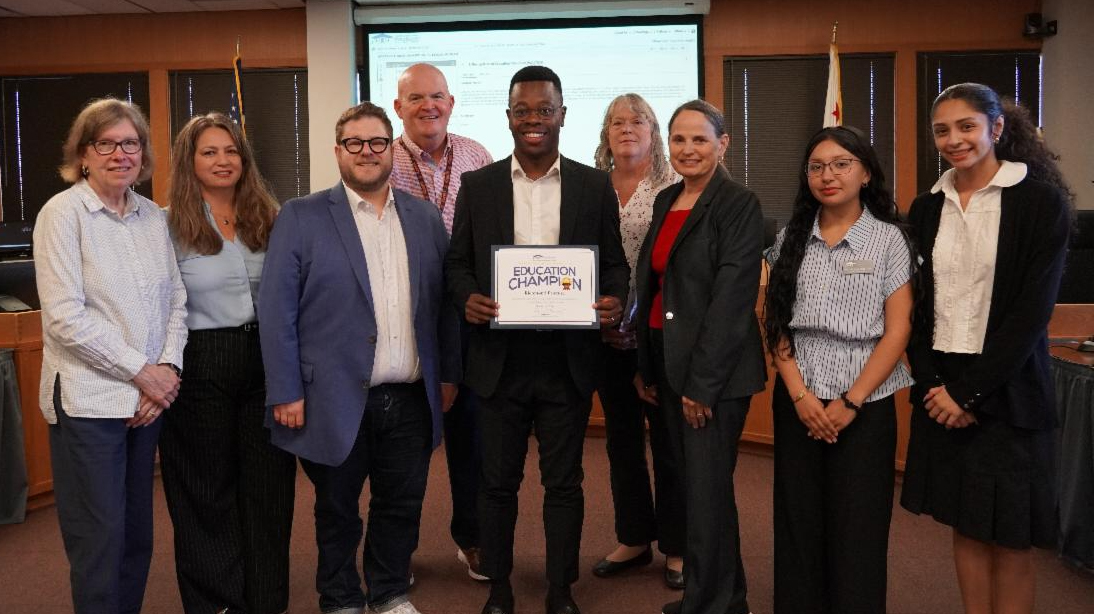
Richmond Promise Executive Director Christopher Whitmore (center) with Contra Costa County Superintendent of Schools Lynn Mackey (right) and members of the Contra Costa County Board of Education, (L-R) President Sarah Butler, Daniel Nathan-Heiss, Vice President Yazmin Llamas, Mike Maxwell, Annette Lewis and student members, Melanie Hernandez-Rios and Valeria Gonzalez-Sandoval. Photo: CCCOE

By Marcus Walton, Director, Communications and Special Projects, Contra Costa County Office of Education

PLEASANT HILL, Calif.— Contra Costa County Superintendent of Schools Lynn Mackey and the County Board of Education recognized Richmond Promise for a decade of helping students in Richmond pursue higher education and career opportunities.

Since its founding in 2016, Richmond Promise has awarded more than $14 million in scholarships to students, according to the organization. Among scholarship recipients, 91% identify as people of color or Indigenous, and 64% are the first in their families to pursue higher education.

“Students in our county need Education Champions like Richmond Promise to make connections and give them a leg up to pursue their dreams,” Contra Costa County Superintendent of Schools Lynn Mackey said. “Programs that provide scholarships and pathways to higher education or job training are the lifelines our kids need, and we need more of them. Thank you to Executive Director Christopher Whitmore, his team, and the Richmond Promise Board of Directors for 10 years of investing in future leaders.”

Richmond Promise is a communitywide college success initiative dedicated to expanding access to higher education for Richmond students and supporting them throughout their academic journeys. Through scholarships, student success programs and partnerships with local organizations, the nonprofit works to build a culture that encourages college enrollment, persistence, and graduation.

The organization’s approach begins with early college awareness and continues through financial literacy, college access, and college completion. Through scholarships, financial aid support, workshops, coaching, career mentorship and peer networks, Richmond Promise helps students navigate the path to higher education and career success.

By connecting students with resources and opportunities, Richmond Promise aims to remove barriers to educational attainment while helping develop future leaders who can contribute to and strengthen their communities.

The Education Champion Award recognizes community partners that demonstrate an exceptional commitment to supporting students, schools and educational programs across Contra Costa County. Honorees help expand opportunities, strengthen community connections, and provide resources that support public education.

About Contra Costa County Office of Education

One of 58 counties in California, Contra Costa County has the 11th largest public-school student population in the state (approximately 169,225 students). Officially established in 1932, CCCOE has a long history of providing direct services to some of the county’s most vulnerable students, including young people who are incarcerated, homeless, or in foster care, as well as students who have severe physical or emotional challenges.

CCCOE also provides support services to schools and school districts in Contra Costa County; services that can be handled most effectively and economically on a regional basis rather than by each of the county’s 286 schools or 18 school districts. These services range from budget approval and fiscal support to technology infrastructure, communication support, and high-level professional development opportunities for educators. CCCOE maintains a website at www.cocoschools.org.

Filed Under: Education, Honors & Awards, News, People, West County

Pittsburg High students plan walkout, march to protest data center project before Council meeting Monday

October 19, 2026 By Publisher 2 Comments

Source: Stop Pittsburg Data Center Coalition

19 minutes before end of school day

Los estudiantes de Pittsburg High planean una huelga y una marcha para protestar contra el proyecto del centro de datos antes de la reunión del Concejo el lunes

19 minutos antes del fin de la jornada escolar

By Allen D. Payton

According to Marifer Miranda, East County Community Organizer for Concord-based Monument Impact’s Antioch office, the Stop Pittsburg Data Center Coalition, is holding a walkout by Pittsburg High School students Monday afternoon, Oct. 19, 2026, at 3:15 p.m. with a half-mile march to City Hall, before the Council meeting at 7:00 p.m. The walkout is scheduled to begin 19 minutes before school lets out after 6th Period which ends at 3:34 p.m. according to Pittsburg High’s Bell Schedule.

WHAT: Student Walkout, March and Evening City Council Meeting

WHEN: Monday, October 19 Walkout at 3:15 pm and City Council Meeting 7:00 pm

WHERE: Pittsburg High, 1750 Harbor Street, Pittsburg to City Hall, 65 Civic Avenue

The Stop Pittsburg Data Center Coalition is an intergenerational collective of families, educators, students, union members, and well-established residents residing in Pittsburg, that are fighting to stop data center development in our city and county. As of Friday, October 16, 2026, our initial petition has almost reached 30,000 signatures with the majority coming from Contra Costa Residents. We also uplift the voices of our neighbors who are mixed-status, disabled, and low-income workers who are the most vulnerable and deeply impacted by this city project.

The previous time the AVAIO Data Center Project was on the City Council agenda was during an explosive August 3rd meeting where City Council defended their decision to approve the data center project and asked for residents to “trust we [City Council] made the decision with the best interest of residents in mind.”

Rendering of proposed AVAIO Digital data center in Pittsburg. Source: City of Pittsburg

Join us for a day of action sparked by Pittsburg High School students where we will march from the front of Pittsburg High School and finish at Pittsburg City Hall. Later in the evening at 7:00 pm, the City Council meeting will review an update from the Community Advisory Committee and receive a recommendation for next steps. Coalition members will be present to give public comment and ensure our demands are heard and met.

Under Item. 4 on Monday night’s meeting agenda, a presentation will be provided to the Council entitled, “Data Center and the Advisory Committee on Data Center Update – An informational overview regarding the advisory committee’s objectives and process.”

Pittsburg residents reject that statement and demand:

1) Implement a legally binding 90-day Moratorium on ALL Phases of Data Center Projects in the City;

2) Ban on ALL Data Projects in the City; and

3) Increased transparency of City Budget & Public Process

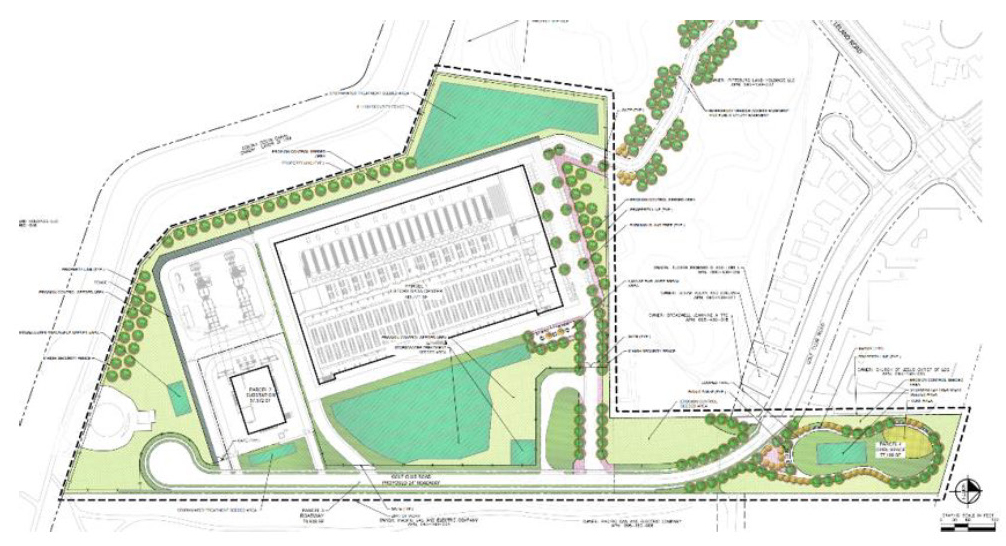
Proposed data center in the Pittsburg Technology Park Specific Plan. Source: City of Pittsburg

How to Provide Public Comment

In-Person – Attend the meeting at the listed location. Complete a speaker card or follow the instructions announced at the meeting. When called, approach the podium and provide your comments.

Remote – Use the Zoom participation link for the meeting or call (669) 900-6833, ID: 898 0554 4017. When the item is open for public comment, use the “Raise Hand” feature. When called, unmute your microphone and provide your comments.

For more information about the Coalition email Pittsburgdatacenter@gmail.com and visit Stop Pittsburg Data Center.

Los jóvenes lideran la lucha local contra el projecto del centro de datos

Huelga estudiantil, protesta en el concejo municipal y seguimiento del Comité Asesor Comunitario

QUÉ: Huelga estudiantil, Marcha y Reunión del Concejo Municipal

CUANDO: Lunes 19 de octubre a las 3:15 (Huelga) y Reunión del Concejo Municipal a las 7PM

DÓNDE: 1750 Harbor St, Pittsburg, CA 94565 (Pittsburg High), 65 Civic Avenue (Concejo Municipal)

QUIÉN: para detener el centro de datos de Pittsburg

La Coalición Stop Pittsburg Data Center es un colectivo intergeneracional de familias, educadores, estudiantes, sindicalistas y residentes consolidados de Pittsburg, California, que luchan para detener la construcción de un centro de datos en nuestra ciudad y condado. Desde el viernes 16 de octubre de 2026, nuestra petición inicial había alcanzado casi 30,000 firmas, la mayoría siendo de residentes del condado de Contra Costa. También alzamos la voz de nuestros vecinos con estatus migratorio mixto, personas con discapacidad y trabajadores de bajos ingresos, quienes son los más vulnerables y se ven profundamente afectados por este proyecto municipal.

La última vez que el proyecto del centro de datos AVAIO estuvo en la agenda del Concejo Municipal fue durante una tensa reunión el 3 de agosto, donde la ciudad defendió su decisión de aprobar el proyecto del centro de datos y pidió a los residentes que “confíen en que [el Concejo Municipal] tomó la decisión pensando en el mejor interés de los residentes”. Los residentes de Pittsburg rechazan esa declaración y exigen:

1) Implementar una moratoria legalmente vinculante de 90 días sobre TODAS las fases de los proyectos de centros de datos en la ciudad;

2) Prohibir TODOS los proyectos de datos en la ciudad; y

3) Aumentar la transparencia del presupuesto municipal y del proceso público.

Únete a nosotros para un día de acción impulsado por Estudiantes de la secundaria de Pittsburg: marcharemos desde la entrada de la escuela hasta las puertas del Concejo Municipal de Pittsburg. Más tarde, a las 7PM, el Concejo Municipal revisará un informe del Comité Asesor Comunitario y recibirá recomendaciones sobre los próximos pasos. Miembros de la coalición estarán presentes para expresar sus inquietudes y asegurar que nuestras demandas sean escuchadas y atendidas.

Más información, aqui: StopPittsburgDataCenter.com y Pittsburgdatacenter@gmail.com.

Filed Under: Business, East County, Education, Government, News, Youth

A parents’ guide to understanding the 2026 California School Dashboard 

October 17, 2026 By Publisher Leave a Comment

Source: California School Dashboard

See the results for your child’s school

By John Fensterwald for EdSource.org. Republished with permission

The California Department of Education this week released the annual California School Dashboard, the state’s multidimensional, multicolored look at student, school and district achievement.

The dashboard was designed to offer parents a quick look at student results, as well as to provide data for guiding school improvement and for holding districts accountable. Trying to serve these different purposes has created a data system that’s complex and comprehensive, often useful, but also daunting for first-time parent users.

The California Department of Education has translated the dashboard into multiple languages and produced dozens of flyers, videos, and an annually updated Dashboard Communications Toolkit. This is a good place to start.

Here are some answers and tips to help parents navigate the dashboard experience.

What’s the purpose of the state dashboard?

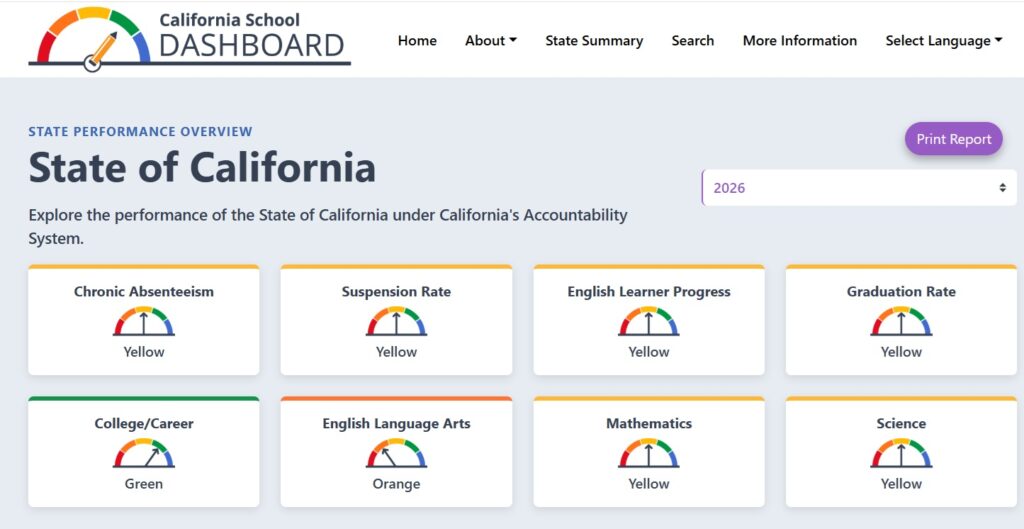
The dashboard gives an extensive look at every school, charter school and school district’s yearly performance as measured by ratings on eight state indicators. They are standardized test scores, of course — English Language Arts and math in grades 3 through 8 and grade 11, English learners’ progress, and, in 2026 for the first time, science.

Along with high school graduation rates, there are ratings for chronic absences, though only through grade 8, and suspension rates; both measures underscore the importance of engagement and school climate to student success.

There is also a measure of how well high schools prepare students for college and careers. It has expanded to include 14 measures. They include:

  • Satisfying the A-G course requirements for admissions to UC and CSU campuses
  • Passing multiple AP and International Baccalaureate courses
  • Successfully completing two semesters of credit-bearing college or CTE courses
  • Attaining a seal of biliteracy or a seal of biliteracy
  • Completing a CTE pathway or pre-apprenticeship program
  • Passing the Leadership/Military Science and Armed Services Vocational Aptitude Battery Test
  • Demonstrating work-based learning.

What’s the point of using colors?

Rating performance by color serves a double purpose. There are five: blue signaling the highest achievement, green, yellow, orange, and red signaling the lowest performance. Each color reflects a blend of two factors, evenly weighted: the current year’s test score or rate, and the change from the preceding year to credit improvement or signal a decline deserving attention.

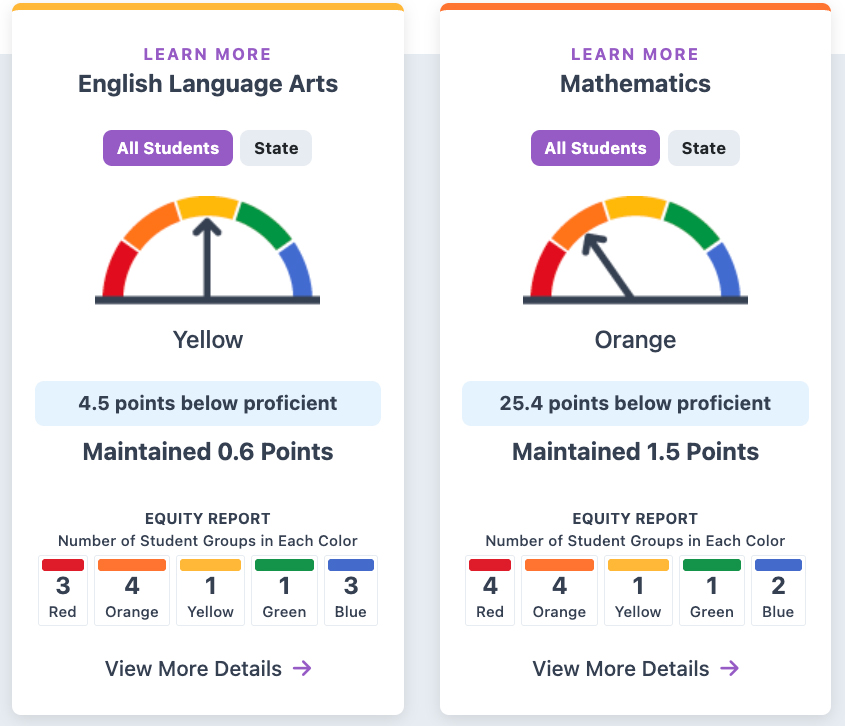
Screenshot of San Jose Unified’s dashboard from the 2026 California School DashboardScreenshot of San Jose Unified’s dashboard from the 2026 California School Dashboard

Screenshot of San Jose Unified’s dashboard from the 2026 California School Dashboard

A school’s goal is to achieve green or blue for any indicator, but a sharp change from the results of students the year before can elevate an otherwise yellow score to green or lower it to orange.

Clicking any indicator on a district or school’s overview page will lead to additional details.

For example, clicking the math score “odometer” for San Jose Unified reveals that students averaged 25.4 scale points below the threshold for proficiency or “meeting standard” in math in 2025-26 — a significant gap. Its students also gained 1.5 points from the year before. The combination is rated orange, two levels below green. The same template applies to other indicators.

Why is there no overall rating for a school’s or district’s performance?

Unlike other states’ dashboards, the State Board of Education chose not to give a summative or top number or rating for a school or district, in order not to overemphasize test scores, at the expense of other important measures. It also wanted to draw attention to achievement gaps among student groups, which would be hidden by focusing on an average score for all students.

How do student groups factor into the dashboard?

Tracking achievement gaps among 15 different student groups, including eight racial and ethnic groups, drives the dashboard. Every student group with a statistically valid number (usually a minimum of 30) receives a color rating on every indicator in every school and district.

While five of San Jose Unified’s student groups scored in the orange range, English learners, foster youth, long-term English learners and students with disabilities scored in the red band. White students achieved a green rating, and Asian students and students with two or more races were rated blue.

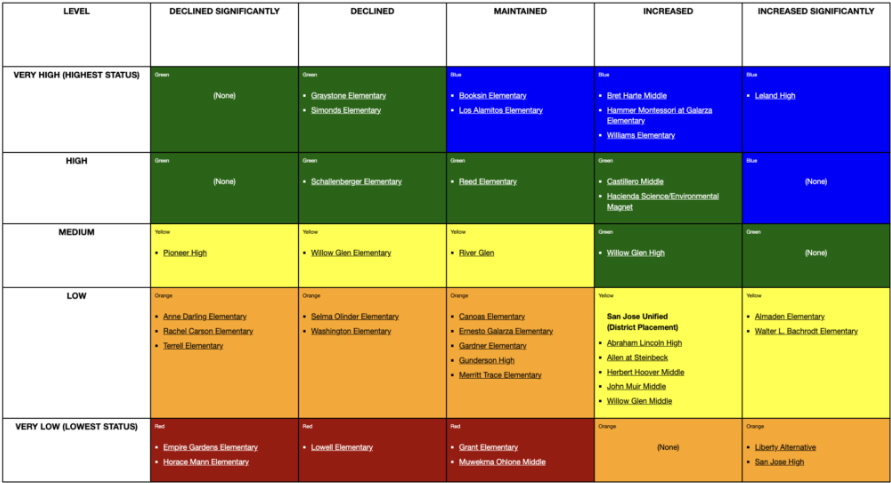
Screenshot of San Jose Unified 5×5 schools report for math scores

Every district’s dashboard includes grids — the 5×5 Placement Reports — that lay out the color rating for every school in the district on every indicator. Here’s the 2025 math 5×5 grid for San Jose’s Unified, for example (The 2026 grid will be released Dec. 15). It shows that of the district’s 40 schools on the grid, 12 rated orange, 10 were yellow, seven were green, six were blue and five were red.

As with all districts with student groups receiving a red rating on an indicator, San Jose Unified must then address low achievement in its Local Control and Accountability Plan, better known as the LCAP.  That’s the three-year improvement plan in which districts must list, among other requirements, an action item, including funding, for every student group with a red rating.

Can you compare districts’ ratings on the state dashboard?

No, but you can compare schools within each district.

Other organizations have included a comparison tool in modifying the state dashboard.

What are local indicators?

The dashboard includes priorities for which there are no statistically valid comparable statewide data or assessments, but nonetheless are vital for successful schools. These include family engagement, school climate and access to a broad course of study.

The State Board of Education requires that districts analyze each local priority and report back to the public annually. Examples are the results of local school climate surveys and the district’s actions to improve public engagement. For example, county offices of education must report on how well they are coordinating services for foster youths and expelled students.

How does dashboard information drive improvement?

Districts in which at least one student group is rated red on two or more priority areas, such as low reading scores and high chronic absenteeism, are designated eligible for “Differentiated Assistance.” They are encouraged to seek guidance from county offices of education or the California Collaborative for Educational Excellence, a small state agency, on how to improve. Differentiated Assistance is voluntary and applies only to districts.

Since the dashboard’s first year, in 2017-18, more than three-quarters of districts, charter schools and county offices have qualified for differentiated assistance, with more than 80% of those identified two or more times.

In 2026, only 144 school districts will qualify for differentiated assistance, down from 418 last year. Recognizing a need to focus on fewer districts with more intensive, effective help, the State Board revised the criteria, and districts will receive assistance for three years, instead of one year.

Districts are selected based on poorly performing subgroups as well as districts’ overall scores receiving red ratings. Most of those qualified because of the low ratings for students with disabilities and long-term English learners, and in some charter schools, for low ratings of Hispanic students, according to Department of Education analysis.

John Fensterwald writes about education policy and its impact in California.

Filed Under: Education, News, State of California

California graduation rate hits 10-year high, but 18% of students are chronically absent

October 16, 2026 By Publisher Leave a Comment

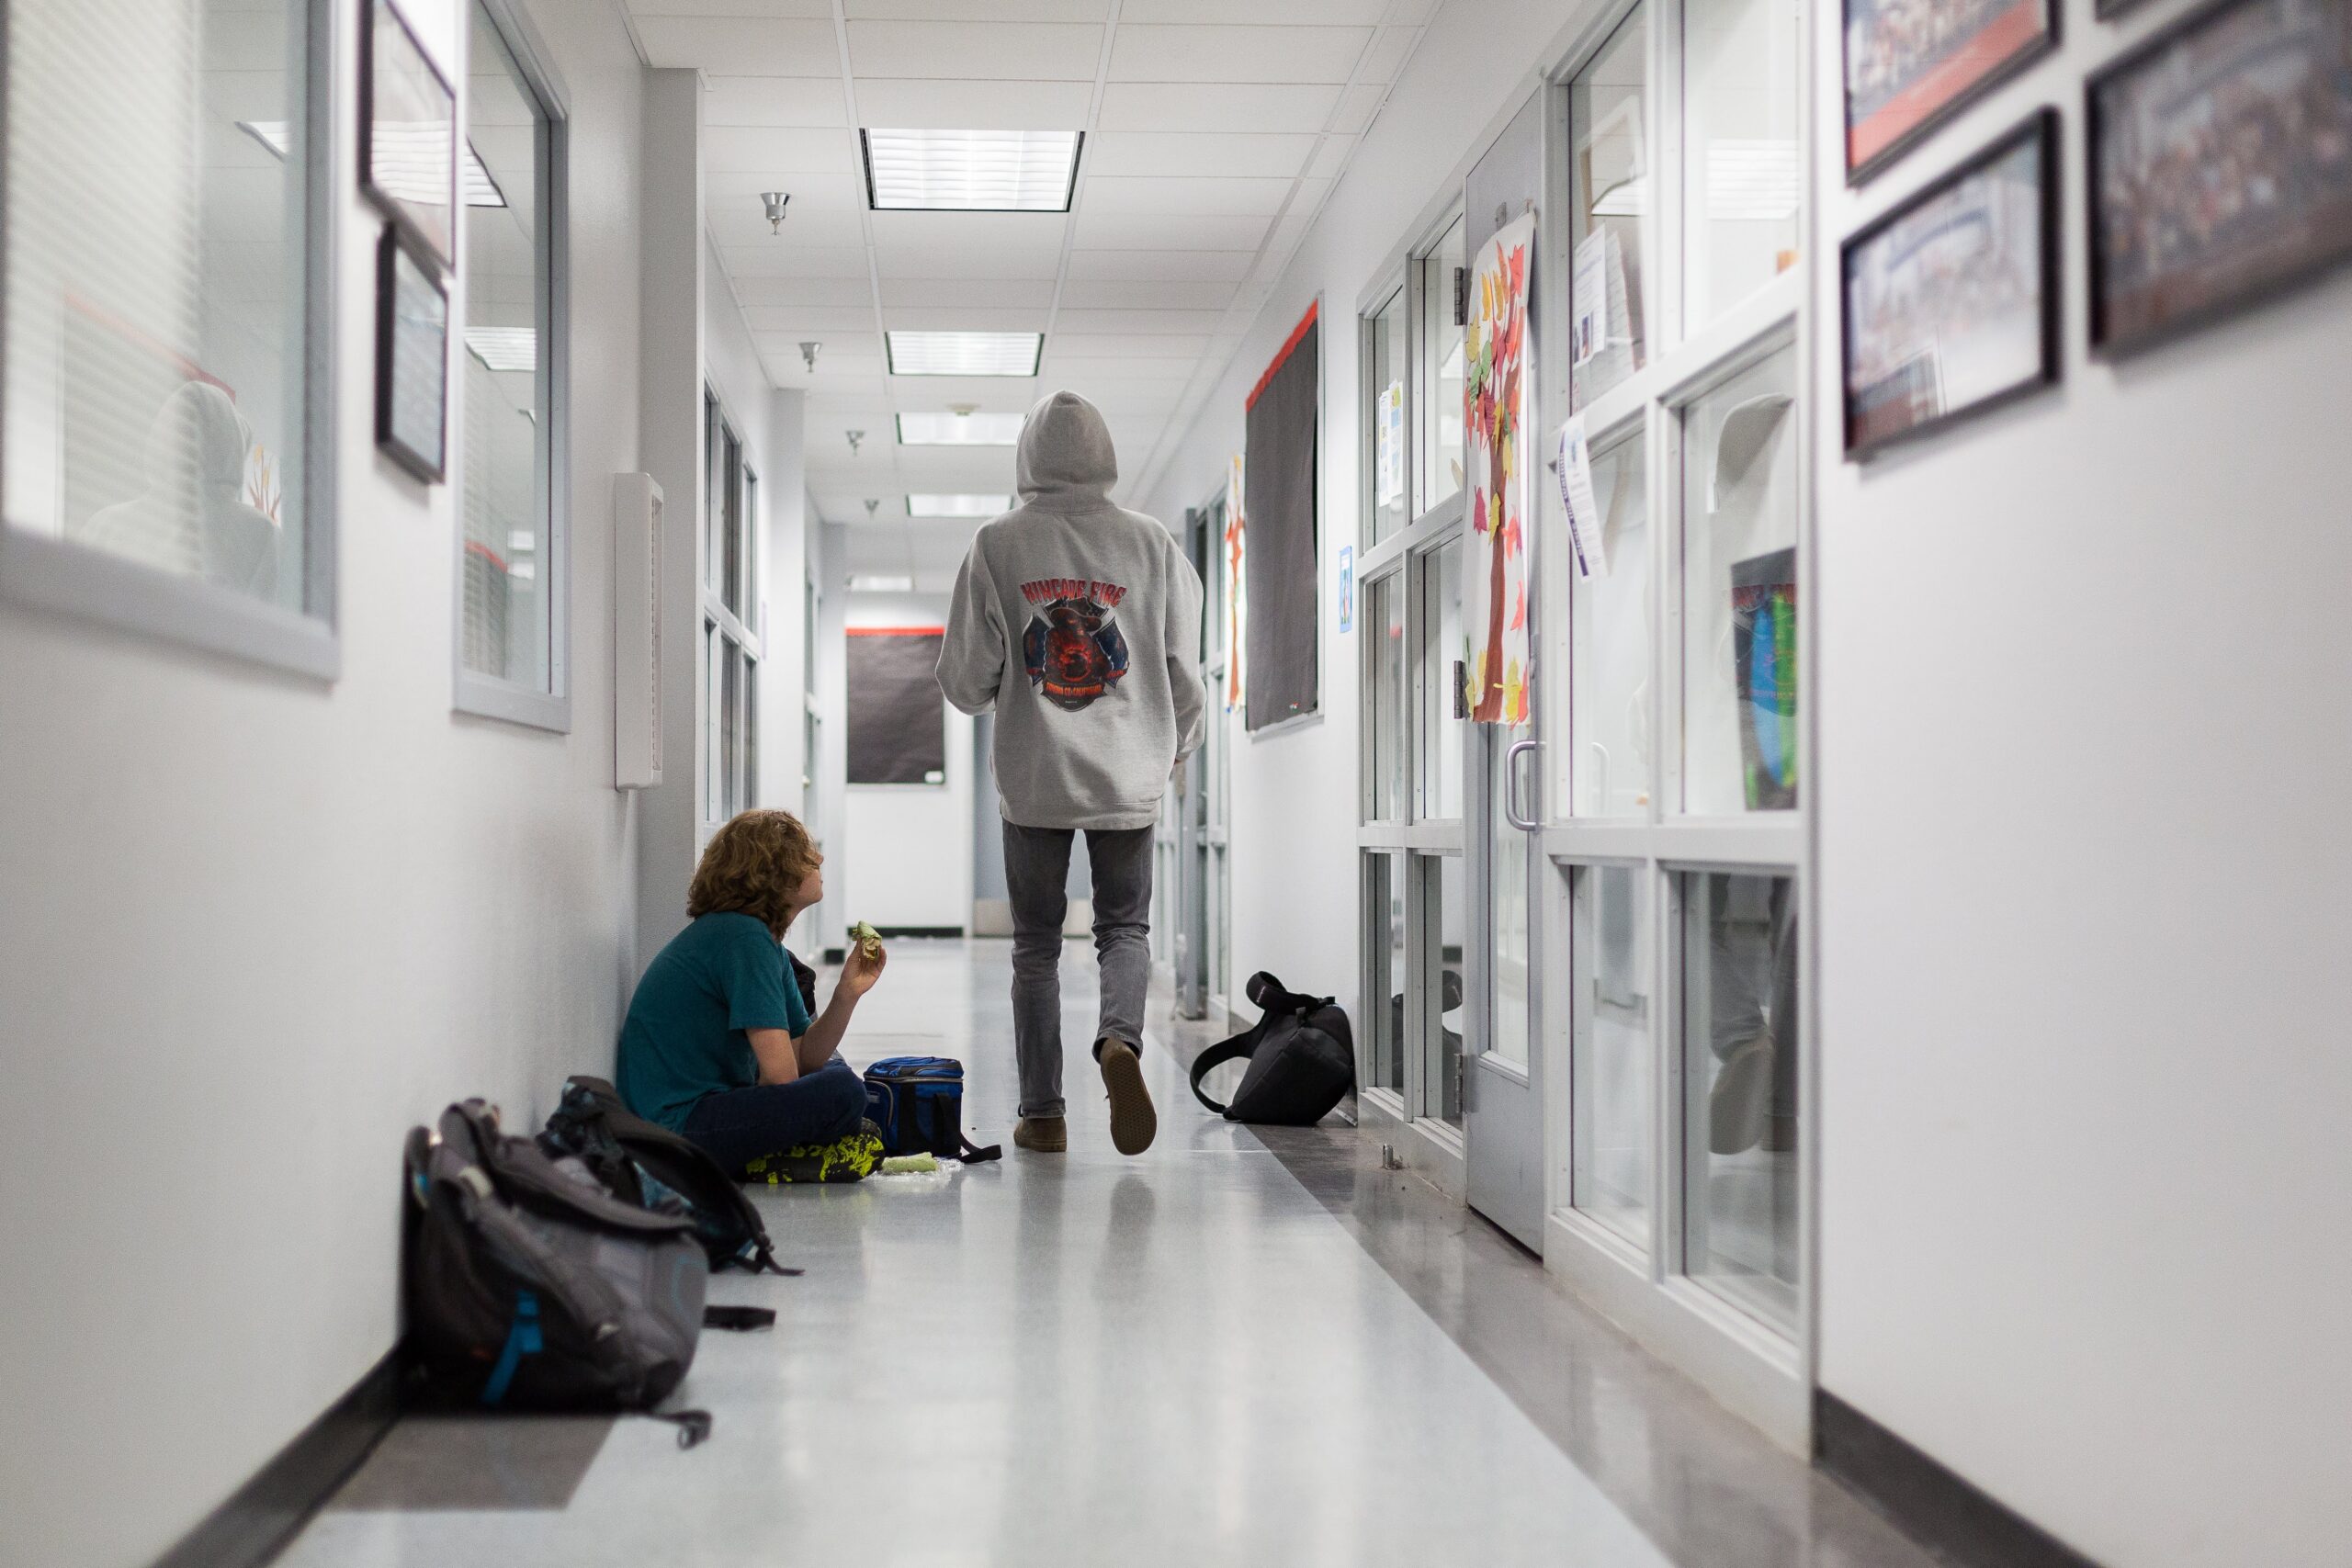
Photo: Julie Leopo/EdSource

By Mallika Seshadri and Vani Sanganeria for EdSource.org. Republished with permission

Top Takeaways

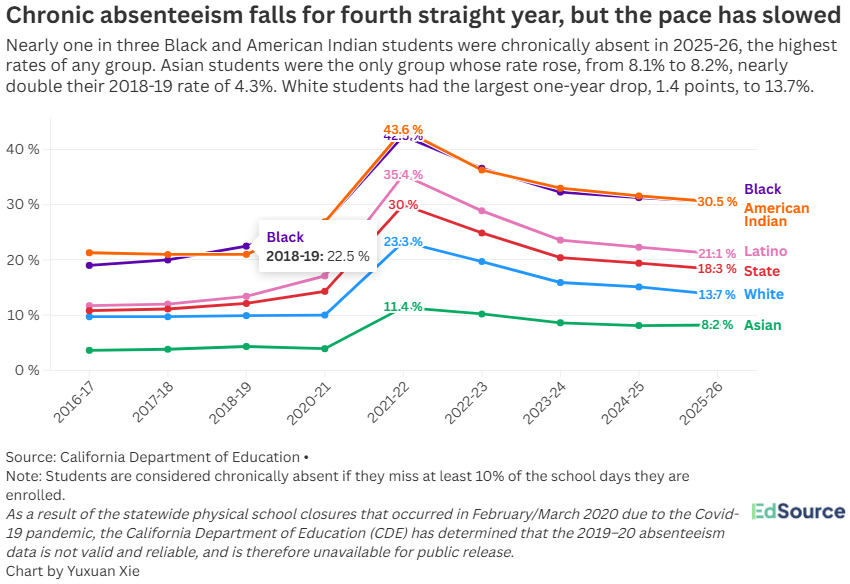
  • Chronic absenteeism among students in 2025-26 decreased, but remained above pre-pandemic levels.
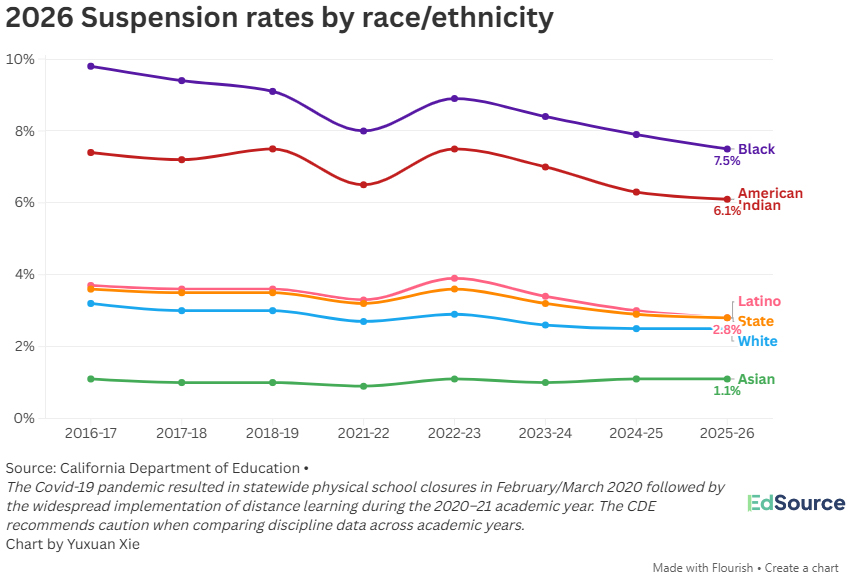
  • Suspension rates dropped minimally.
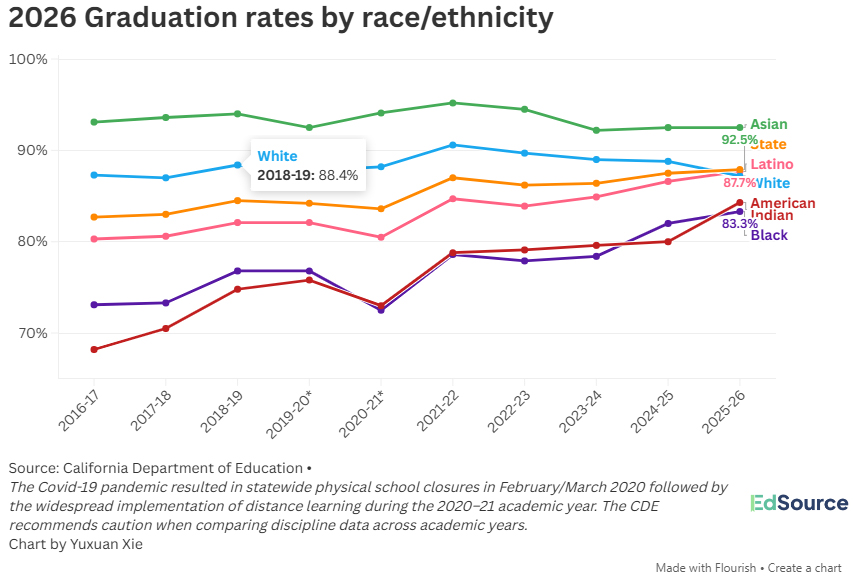
  • Graduation rates reached their highest in the past decade.

California’s graduation rates reached a decade high last school year, while chronic absenteeism and suspensions continued to decline, according to the California School Dashboard released Thursday.

But progress remained uneven. Chronic absenteeism is still higher than before the pandemic, suspension rates have fallen only minimally and substantial disparities persist among student groups.

“At a time when California continues to focus on accelerating learning and closing opportunity gaps, these results provide important evidence that our sustained investments are making a difference,” said Gov. Gavin Newsom in a statement.

The California Department of Education’s dashboard tracks student success across several measures, including chronic absenteeism, suspensions, English learner progress, graduation rates and college and career readiness.

This is the first year the dashboard has been released alongside the state’s Smarter Balanced Assessment scores in English language arts, math and, now, science, giving educators and families a broader view of student outcomes.

“That’s a smart thing to do,” said Tyrone Howard, a professor of education at UCLA. “I think that way we kind of get as holistic of a picture as we can from multiple standpoints.”

The 2025-26 data comes amid a significant, ongoing decline in California student enrollment. Since the 2016-17 academic year, the state has lost 496,975 students — an 8% enrollment decrease.

Over the past decade, the state has also seen significant changes in the student population, with more students identifying as Asian, two or more races and not reported. There has also been an increase in students with disabilities and in homeless youths.

Chronic absenteeism remains above prepandemic levels 

Chronic absenteeism continued to decline in California during the 2025-26 school year, falling 1.1% from the previous year to 18.3% among students in transitional kindergarten through 12th grade. The rate reached 30% during the pandemic-era spike in 2021-22.  Students who are chronically absent have missed at least 18 instructional days, or 10% or more of the school year.

“The fact that we’re seeing drops, but not huge drops, is not too different from what you’re seeing across the country,” said Hedy Chang, CEO and president of Attendance Works, a nonprofit that works with school districts to reduce absenteeism.

The persistence of a high percentage of students chronically absent “points to the need for us to even deepen our work to reduce chronic absence to be even more strategic,” she added.

Downey Unified School District is among the districts that lowered its TK-8 chronic absenteeism rate from 19.2% last year to 18.4% in 2025-26.  Its TK-12  rate also declined, from 20.4% to 19.9%.

Roger Brossmer, Downey Unified’s superintendent, attributes the progress to new schedules tailored to students’ needs. The district plans to “double down,” on its efforts to reduce chronic absenteeism, which remains higher than the state average, with a special focus on English learners.

Brossmer said Downey’s strong improvement in test scores – among the highest in the state – has reinforced his belief in the connection between student achievement and attendance.

“If they weren’t progressing, the number one thing they had in common was they weren’t coming to school,” Brossmer said. “And so we’ve shifted from a punitive model to more of a ‘we miss you, we need you here’ model.”

Pacific Islander, American Indian or Alaska native, African American and Hispanic or Latino students continued to experience chronic absenteeism at higher rates than the statewide average. The same was true for foster youths, homeless youths, students with disabilities, socioeconomically disadvantaged students and English learners.

Migrant students had a lower rate of chronic absenteeism than the state average, however.

Chang said that migrant student rates may be lower because students are leaving the state, or being detained, before they reach the 30-day attendance requirement to be counted toward chronic absenteeism data.

“It is possible that migrant youth are moving too far. You’d have to look at mobility issues at the same time,” Chang said.

Suspensions decrease minimally 

California’s suspension rate measures the number of students who were suspended for at least one day. It fell by 0.1 percentage points between the 2024-25 and 2025-26 school years, to 2.8%.

That is part of a several-year trend of falling suspension rates since 2022-23, when the rate was 3.6%.

“It’s encouraging that suspensions are going down, but the racial disparities are still pretty noticeable and pretty significant,” Howard said.

African American students had the highest suspension rates among racial and ethnic groups, followed by American Indian/Alaska Native and Pacific Islander students. Hispanic or Latino students were close to the statewide rate.

Foster youths had a much higher suspension rate of 13%, while homeless youths, students with disabilities, migrant youths, socioeconomically disadvantaged students and English learners also exceeded the statewide rate.

Howard said the state should provide more comprehensive data that includes both in-school and out-of-school suspensions.

“I’ve seen in other states (cases) where their out-of-school suspension rates have gone down, which is what they lead with,” Howard said. “But then, when you do a deeper dive looking at the in-school suspension rates, they have gone up.”

Graduation rates: the highest in a decade 

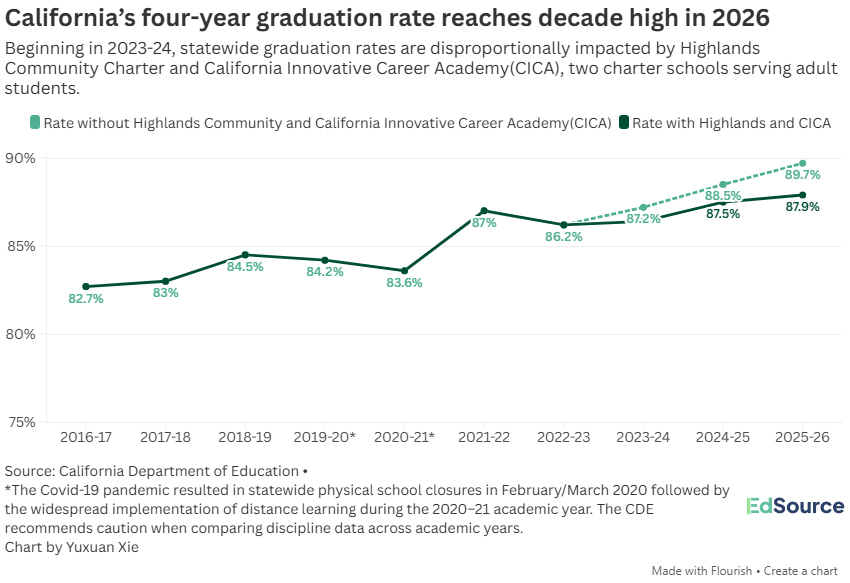
California’s graduation rate reached 87.9% in 2025-26, the highest in a decade, according to the dashboard.

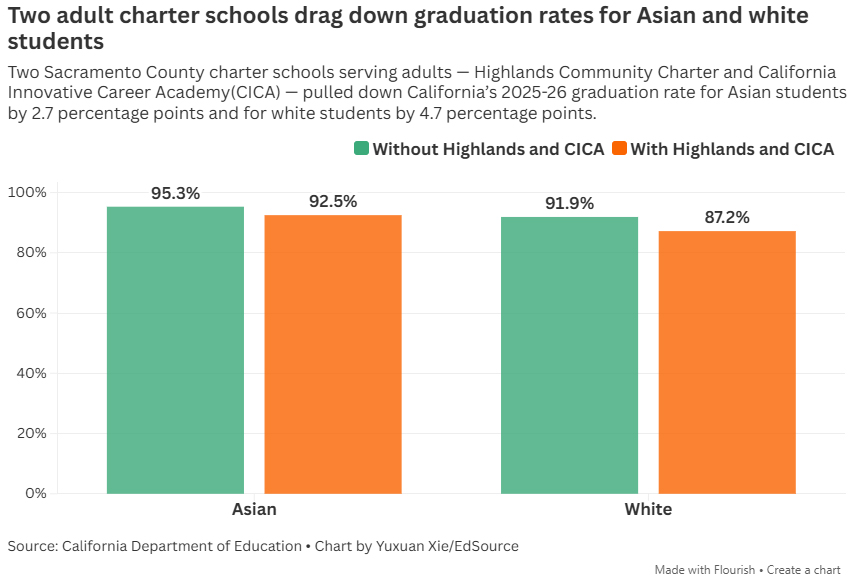
Graduation rates among Filipino, Asian and students identifying as two or more races exceeded the statewide average.  Migrant students also graduated at a higher rate than the state average.

It’s likely that graduation rates are even higher in the state. The California average was skewed downward by two schools — Highlands Community Charter and California Innovative Career Academy.

College readiness also improved. Nearly 55% of graduates met the basic minimum requirements for the CSU and UC systems, a 0.9 percentage point increase from the previous year.

Meanwhile, 17.1% earned the State Seal of Biliteracy, a special designation on a student’s diploma showing a high rate of proficiency in a second language. And 33.8% received the Golden State Seal Merit Diploma, which shows mastery in at least six subject areas, marking a 0.8 and a 1.5 percentage point increase, respectively.

Troy Flint, spokesperson for the California School Boards Association, said graduation rates and college readiness are moving in the right direction, but more students need to meet standards in English language and math.

“A certain percentage of students are being pushed through without gaining the knowledge and skills that signify they’ve achieved a truly meaningful high school education and are prepared for their next step, whether that’s college or career,” Flint said.

Mallika Seshadri covers Los Angeles and LAUSD.

Vani Sanganeria covers student health and wellbeing as EdSource’s Local News Fellow, a partnership with the UC Berkeley Graduate School of Journalism.

Filed Under: Education, News, State of California

Recent report finds public money subsidizing concert business including at Concord’s Toyota Pavilion, Shoreline Amphitheatre

October 15, 2026 By Publisher Leave a Comment

Photo: Vanderbilt Policy Accelerator for Political Economy and Regulation

“Sold Out: How state and local governments pay for Live Nation’s monopoly”

“A federal jury found that Live Nation monopolized the amphitheater market, which has led to higher prices and fewer choices for music fans across the country.” – Report Co-Author Brian Shearer

 “This is not a credible report. State and local governments invest in live entertainment because venues are economic engines…” – Live Nation spokesperson. Shares statements on jury verdict and DOJ settlement

By Vanderbilt Policy Accelerator, Vanderbilt University

Concord, CA–A recent analysis published by the Vanderbilt Policy Accelerator for Political Economy and Regulation (VPA) reveals that state and local governments own nearly half of Live Nation’s large outdoor amphitheaters and stadiums and have been subsidizing the company’s live events business to the tune of more than $420 million. The report raises questions about the propriety of local governments devoting significant public resources to a company as large and as powerful as Live Nation, particularly as nearly two-thirds of independent music venues struggle to turn a profit.

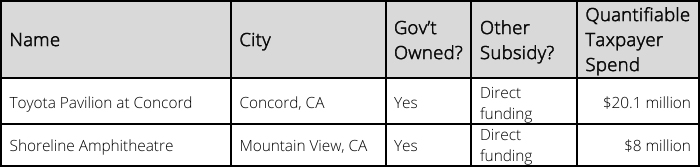
The report examines 64 large outdoor amphitheaters and stadiums operated by Live Nation across the country, including Toyota Pavilion at Concord in Concord, CA and Shoreline Amphitheatre in Mountain View, CA. VPA’s researchers found that in 30 of 64 instances, these venues are not owned by Live Nation or another private actor. Instead, Live Nation operates buildings owned by state or local governments.

The City of Concord owns the Pavilion, and the City of Mountain View owns Shoreline.

Sections of Live Nation’s venue chart. Source: VPA

These contracts are often never subject to competitive bidding, resulting in highly favorable terms for Live Nation, including cheap rent, the ability to generate revenue by selling naming rights to a government building, and even taxpayer support to build and maintain the properties from which Live Nation profits. Rarely, if ever, do these contracts insist on terms to advance the public interest, such as requirements to operate the venue as an “open room” for artists not promoted by Live Nation, limits on excessive fees, or street pricing for concessions.

In addition, Vanderbilt Policy Accelerator found that at least $420 million in taxpayer money went toward benefiting Live Nation, not including the value of below-market rent or profits from selling naming rights on government buildings.

“A federal jury found that Live Nation monopolized the amphitheater market, which has led to higher prices and fewer choices for music fans across the country,” said Brian Shearer, director of competition and regulatory policy at Vanderbilt Policy Accelerator and a co-author of the report. “But cities and states don’t need to wait for a court order to begin rectifying this problem. They can simply stop financing Live Nation’s venues and evict them from public-owned venues.”

The findings also highlight that government contracting could be a powerful lever for addressing Live Nation’s monopoly. To help local governments build a live music ecosystem that reinvests in local communities rather than enriching a powerful monopoly, the report proposes two potential solutions.

The first, an “outsourcing with conditions” model, would open venue operating contracts to competitive bidding with strict conditions to advance the public interest and a preference for independent venue operators familiar with the unique needs of local communities. The second, a “public D.I.Y.” model, proposes that cities operate their properties through a specially chartered public nonprofit corporation. Both approaches would enable local governments to operate their large venues and advance important public-interest goals while avoiding siphoning taxpayer funds onto the balance sheets of an extractive monopoly.

Read about the report in VPA’s Substack and watch the YouTube video.

Live Nation Responds

In response to the report, a spokesperson for Live Nation wrote, “This is not a credible report. It is a poorly researched and one-sided advocacy piece backed by independent venues who don’t want to compete against new and renovated venues regardless of the benefits to fans and communities. State and local governments invest in live entertainment because venues are economic engines that bring artists, fans, jobs and spending to their communities. Our amphitheaters generate an estimated $5.8 billion in local economic activity and $800 million in municipal taxes each year, while supporting nearly 48,000 jobs. And over the last decade, we’ve invested more than $825 million of our own funds improving these venues.”

In addition, they provided the following facts:

  • $5.8B in estimated annual local economic activity generated outside our amphitheaters by concerts and fans
  • ~$800M annually in municipal taxes from taxable amphitheater revenue streams, including tickets, food & beverage and merchandise
  • 47,609 full- and part-time employees, representing approximately $225M in annual wages
  • $825M+ invested in renovations and improvements across the amphitheater portfolio over the last 10 years
  • ~$450M in rent paid to government landlords across 30 amphitheaters over the last 10 years
  • Public investment in major sports and entertainment venues is commonplace. Recent examples include:
    • Kansas City Chiefs — $1.8B new stadium
    • Tennessee Titans — $1.26B new stadium
    • Washington Commanders — $1.0B new stadium
    • Buffalo Bills — $850M new stadium
    • San Antonio Spurs — $800M new arena
    • Jacksonville Jaguars — $775M stadium renovation

When pressed further and asked about the federal jury findings, Live Nation shared the following statements on the settlement issued on March 9, 2026 and the jury verdict issued on April 15, 2026:

Live Nation Entertainment Reaches Settlement With U.S. Department of Justice

Live Nation Entertainment, Inc., the world’s leading live entertainment company, announced today (March 9, 2026) that the company has reached a settlement with the United States Department of Justice (DOJ) in the antitrust lawsuit brought by the DOJ. The company has consistently maintained that the DOJ’s allegations were without merit, and a portion of the original claims were dismissed by the court before trial began. This settlement will resolve all remaining matters with the DOJ, without any admission of wrongdoing, and the settlement will be reflected in a final proposed judgement that will be submitted to the court for approval.

-Live Nation Entertainment issued the following statement: 

We are pleased to have settled our lawsuit with the United States Department of Justice.

“Today marks a major step in improving the concert experience for artists and fans throughout the United States. Live Nation is proud to lead the way enhancing this experience with our amphitheaters, which will be open to all promoters, allowing these promoters to decide how best to distribute up to 50% of the tickets, and capping ticketing service fees at 15%. By giving artists greater flexibility in choosing their promotional partners and ticketing strategy while also keeping the cost of a concert more affordable for fans, we are putting more power where it should be – with artists and fans,” said Michael Rapino, President and CEO of Live Nation Entertainment.

In addition, Live Nation will be divesting its 13 exclusive booking agreements with amphitheaters nationwide. All owned and operated amphitheaters will continue to be operated by Live Nation as open venues, promoting competition and maximizing show volume.

In ticketing, Ticketmaster will be providing both exclusive and non-exclusive ticketing proposals to all major concert venues, which preserves the rights of venues to seek the type of contracts they preferred over the years while providing the government with restrictions to mitigate their concerns. At the same time, for venues that choose to do so, they may distribute some portion of their tickets through other primary ticketing marketplaces.

“We have never relied on exclusivity to drive our ticketing business, it has simply been the result of having the best products, services and people in the industry. We are happy to take greater steps to empower artists and venues in their ticketing decisions, and are confident we will continue to succeed on the quality of what we deliver,” continued Rapino.

This settlement will also include an eight-year extension of the company’s consent decree with the DOJ, including retaliation and conditioning terms, providing venues ongoing comfort the company does not condone such behavior.

There is no financial component to the settlement with the DOJ. This does not settle the claims of all plaintiffs in the lawsuit, and the company has created a $280 million settlement fund to address the states’ damages claims.

Statement on Jury Verdict

The jury’s verdict is not the last word on this matter. Pending motions will determine whether the liability and damages rulings stand.

Live Nation will soon renew its motion for judgment as a matter of law, which the Court deferred until after the jury returned its verdict. That motion addresses all liability theories. The Court previously noted that Live Nation’s motion raises serious issues.

There is also a pending motion to strike the damages testimony on which the jury’s award was based. The Court deferred ruling on that motion as well, while noting significant concerns with the damages expert’s analysis.

Of course, Live Nation can and will appeal any unfavorable rulings on these motions.

The jury’s award of $1.72 per ticket applies to a limited number of tickets—those sold at 257 venues, which represent about 20% of total tickets—and only to purchases by fans (excluding brokers) in certain states over the past five years. Based on that scope, we believe the aggregate single damages figure would be below $150 million, which would be trebled.  In connection with the DOJ settlement, Live Nation has already accrued $280 million toward state damages and civil penalty claims.

Injunctive relief will be determined by the Court after the states make a remedy proposal, which we expect in the coming weeks. In the meantime, the Tunney Act proceedings regarding the DOJ settlement will continue. We remain confident that the ultimate outcome of the States’ case will not be materially different than what is envisioned by the DOJ settlement.

No Outside Funding for VPA Research, Report

VPA was asked who funded or helped develop their research and how much was contributed financially to the effort.

They responded, “VPA is an independent academic center at Vanderbilt University. There was no outside sponsor for this research, and VPA did not receive any external funding to compile this report.”

City of Concord Studying Report

In response to the report, Colleen Awad, City of Concord Community Relations Manager wrote, “We are now reviewing it, as it was just released, and do not have a comment at this time.”

City of Mountain View Responds

Also in response, Lenka Wright, the City of Mountain View’s Chief Communications Officer in the Communications and Outreach Division of the City Manager’s Office wrote, “Mountain View’s Shoreline Amphitheatre is a premier outdoor concert venue that is operated by Live Nation. Upon entering the initial lease with Live Nation, the City has not paid for any facility upgrades or expansions. Per the lease, these are Live Nation’s expenses and the City Council must approve any recommended facility improvements. The rent that Live Nation pays to the City for Shoreline Amphitheatre operations is also competitive. In addition, the City has retained the naming rights to the venue, unlike some other California jurisdictions named in the report.”

About Live Nation Entertainment

Live Nation Entertainment (NYSE: LYV) is the world’s leading live entertainment company comprised of global market leaders: Ticketmaster, Live Nation Concerts and Live Nation Media & Sponsorship. For additional information, visit www.livenationentertainment.com.

About VPA

The Vanderbilt Policy Accelerator for Political Economy and Regulation (VPA) focuses on cutting-edge topics in political economy and regulation to swiftly bring research, education, and policy proposals from infancy to maturity. To learn more about our work, visit vu.edu/vpa.

Please check back later for any updates.

Allen D. Payton contributed to this report.

Filed Under: Arts & Entertainment, Business, Education, Government, News

New California test scores show most students don’t meet standards in math, English or science

October 15, 2026 By Publisher Leave a Comment

Third graders at Frank Sparkes Elementary School in Winton. Credit: Zaidee Stavely / EdSource

Proficiency in math, English language arts rose slightly, but remains below pre-Covid levels

By Zaidee Stavely, Lasherica Thornton, And Yuxuan Xie for EdSource.org. Republished with permission

Top Takeaways

  • Student proficiency in math and English language arts rose slightly, though remains below pre-Covid levels, according to newly released California standardized test scores.
  • Achievement gaps persist between Black and Latino students and white and Asian students.
  • It’s likely still too early to see improvements from investments in early literacy.

California students’ proficiency in math and English language arts follows the same trend in 2026 as the past few years: incremental improvement from the year prior, with the majority of students below grade-level standards.

The state’s release of 2025-26 student test scores on Thursday showed slight growth in several areas, but California still hasn’t reached the elusive milestone of raising scores back to pre-Covid levels.

In English language arts, 49.3% of students scored proficient or advanced in 2025-26, up just a half percentage point from the previous year, according to the latest standardized test results released Thursday.

In math, the number of students earning a proficient or advanced score increased by 1.2 percentage points, with 38.4% earning proficient or advanced.

Prior to the pandemic, in 2018-19, 51.7% of California students met or exceeded state standards in English language arts, and 39.7% were proficient in math.

Fewer students — 36% — achieved a proficient or advanced score on the science test, though it was the subject with the most improvement. The portion of students meeting standards in science rose 3.3 percentage points since last year, and 6.1 points since before the pandemic.

“Today’s results tell a story of continued progress, but also of the work that remains ahead,” Linda Darling-Hammond, president of the State Board of Education, said in a statement. “Our responsibility now is to build on this momentum and ensure that progress reaches every student and every community.”

Black and Latino students made larger gains than white and Asian students but yawning racial and ethnic achievement gaps remain. Black students were the only group to surpass pre-pandemic proficiency levels in both math and English.

While education leaders are often encouraged by academic growth, the pace of growth — half a percent to a little over a percent in most cases — is “unacceptable,” said Troy Flint, chief information officer at the California School Boards Association.

“It does not suggest that we have the right strategic or operational infrastructure in place to properly support our school districts and county offices of education in accelerating student achievement,” Flint said. “We need serious reforms to state level education governance and operations and assessment, or we will never deliver for our kids at the level that we need.”

Disparities persist among different racial, ethnic, socioeconomic groups

The number of proficient Black and Latino students remains far below their white and Asian peers, and similar gaps exist between students based on income.

The number of Black students reaching proficiency in English language arts increased 0.9 percentage points from last year to 33.7%. The number of proficient Latino students rose to 39.6%, a gain of 0.8 percentage points from last year. Asian students’ proficiency fell by 0.9 percentage points to 73.5%. About 61.7% of white students scored proficient in English language arts, a figure essentially flat from the prior year.

In math, about 21.5% of Black students scored proficient, a 1.5 percentage-point improvement from 2025, the highest jump across the four student groups. About 27% of the state’s Latino students scored proficient, 1.2 percentage points higher than 2025. Asian students (70.5% math proficiency) and white students (51.4%) saw more modest growth.

Although socioeconomically disadvantaged students improved in both subjects, most still did not meet standards. About six in 10 (61.1%) did not meet the English standards. Nearly three in four (72.6%) did not meet the math standards.

The achievement gap between students who are socioeconomically disadvantaged and the rest of their peers remains at about 30 percentage points in both subjects.

Melissa Valenzuela-Stookey, research director at EdTrust West, called the test scores “sobering.”

“Once again, the results show glaring gaps in outcomes for Black and Latino students, Native American students, English learners and students from low-income households, which suggests that our systems still aren’t providing the supports and opportunities they need to reach their full potential,” Valenzuela-Stookey said.

No improvement in early reading yet

The percentage of California third graders who scored proficient or advanced on the English language arts test stayed flat, from 44.2% in 2024-25 to 44.1% in 2025-26.

The state has invested millions in improving how schools teach children to read, but it is likely too soon to see many results from the new policies. Last year, schools began screening all students in grades K-2 for risk of reading difficulties to provide support for kids who need it.

The children who benefited from that last year won’t take standardized tests until this school year. The State Board of Education only recently approved a list of literacy training programs for districts to use.

“While the state has gotten a lot more focused on improving reading, it’s not surprising it wouldn’t have an impact yet,” said Marshall Tuck, CEO of EdVoice and one of the advocates that pushed for the reading reforms. “The earliest you would see impacts from those policies directly would be this school year.”

English language proficiency

More than 133,000 English learners —15.4% — tested as proficient on the English Language Proficiency Assessment for California (ELPAC) in 2025-26. Under a new state law, those students are now eligible to be automatically reclassified as fluent and proficient in English. The percentage of English learners who achieved proficiency was similar to last school year.

English learners who have not yet achieved proficiency in English tend to do poorly on standardized tests, but once they are reclassified as fluent in English, they often do better on tests than native English speakers.

In 2025-26, 60.9% of former English learners achieved proficiency in English language arts, compared to 53.5% of native English speakers.

Martha Hernandez, executive director of Californians Together, a nonprofit advocacy group for English learners, said the scores show that the state needs to do more work to make sure English learners have full access to the curriculum in all subjects and to move more students to proficiency.

“Students who become proficient in English do not stop becoming part of the English learner success story,” Hernandez said.

Dashboard released simultaneously

For the first time this year, the California Department of Education released the test scores at the same time as the “dashboard,” the state’s accountability system. The dashboard measures schools’ improvement over time on test scores and on other measures, such as graduation, college and career readiness, suspension and chronic absenteeism.

The state gives schools a color of the rainbow ranging from red (signaling the least achievement or improvement), orange, yellow, green and blue (signaling the highest achievement).

The state gave schools an overall score of orange for English language arts, and yellow for math and science.

Jessica Sawko, director of education at Children Now, advocated for science to be included in the state’s accountability system because she said science helps prepare students for college and career.

She said it was “heartening” to hear that there was improvement in science scores, but the percentage of students achieving proficiency is much too low.

“Here we are at not even 40% of kids achieving proficiency or better. That’s more than half of the kids not there yet, and yet we’re at a yellow?” she said.

Learn more about the California Dashboard by reading A parents’ guide to understanding the 2026 California School Dashboard  | EdSource.


Filed Under: Children & Families, Education, News, State of California, Youth

California feeds kids at school. What happens on the weekend?

October 3, 2026 By Publisher Leave a Comment

Rescued produce sorted at White Pony Express before delivery to community partners in Contra Costa County. Source: WPE

Guest Commentary

By Tyler McCarthy, Outreach Associate, White Pony Express

On Friday afternoon, for a student who eats breakfast and lunch at school, the dismissal bell does more than end the school day. It starts a 68-hour clock. The last dependable school meal of the week has just been served. The next one won’t arrive until Monday morning.

We hear from our school partners what those hours can mean. As one parent liaison put it: “My thinking was that if I can give them a meal for Saturday, then they only have to get through Sunday. That lessens the need.”

California has done something remarkable. In 2022–23, it became the first state in the nation to guarantee every public school student access to free breakfast and lunch, regardless of family income. Nearly 3.5 billion school meals have been served since the program began.

It works. And at a time when changes to federal nutrition programs are putting additional pressure on some California families, it’s an achievement we must protect.

But hunger doesn’t follow a school calendar.

California’s universal meals program feeds children during the school day. Children still need to eat Friday night, Saturday, Sunday, holidays and school breaks. California has also embraced summer grocery benefits for eligible families, another important piece of the solution. But summer assistance does not solve the gap that arrives every week between Friday afternoon and Monday morning.

For a family already choosing between rent, utilities, transportation, and groceries, those aren’t simply gaps in a schedule. They can be the days the refrigerator runs empty. That’s where White Pony Express makes an enormous difference.

Every day, White Pony Express drivers collect surplus food from grocers, farms, wholesalers, and restaurants – high-quality food that is perfectly good but has nowhere to go. We sort it for quality the same day and deliver it, free of charge, to neighbors throughout Contra Costa County. Of the 135,000 people White Pony Express serves each year, nearly one-third – about 40,300 – are children.

Photo: WPE

Our School Pantry Program brings fresh groceries directly into 23 school communities where 80 percent or more of students qualify for free or reduced-price meals. Families shop at no cost, with no forms and no questions asked.

One pantry coordinator remembers a young mother raising three children alone after losing her husband. She came to the pantry for groceries, including peanut butter and chicken.

“She doesn’t have money to buy much,” the coordinator told us, “but she told me it’s a blessing to have White Pony Express helping us.”

Since the School Pantry Program began in 2015, White Pony Express has delivered more than three million pounds of food to school communities – the equivalent of roughly 2.5 million meals.

The model works because it connects two resources that already exist: good food that would otherwise go unused and trusted neighborhood schools where families already gather.

It also demonstrates something larger. Public programs and community organizations do not have to compete with one another. They can complete one another.

Photos: WPE

California has shown what is possible when we make a public commitment to feed children at school and then build a system capable of doing it at an extraordinary scale. Now we need to look just as honestly at the hours the school cafeteria cannot cover.

More than two million California children still lack reliable access to healthy food. For them, the problem doesn’t begin Monday morning. It begins Friday afternoon, when the bell rings. And that is a gap communities like ours can – and must – close.

To volunteer, donate food, or support the School Pantry Program, visit whiteponyexpress.org.

Filed Under: Children & Families, Education, Food, News, Non-Profits, Opinion

The Campaign for College Opportunity names Los Medanos College a 2026 Pathway Champion of Placement

October 2, 2026 By Publisher Leave a Comment

LMC Latino students excel

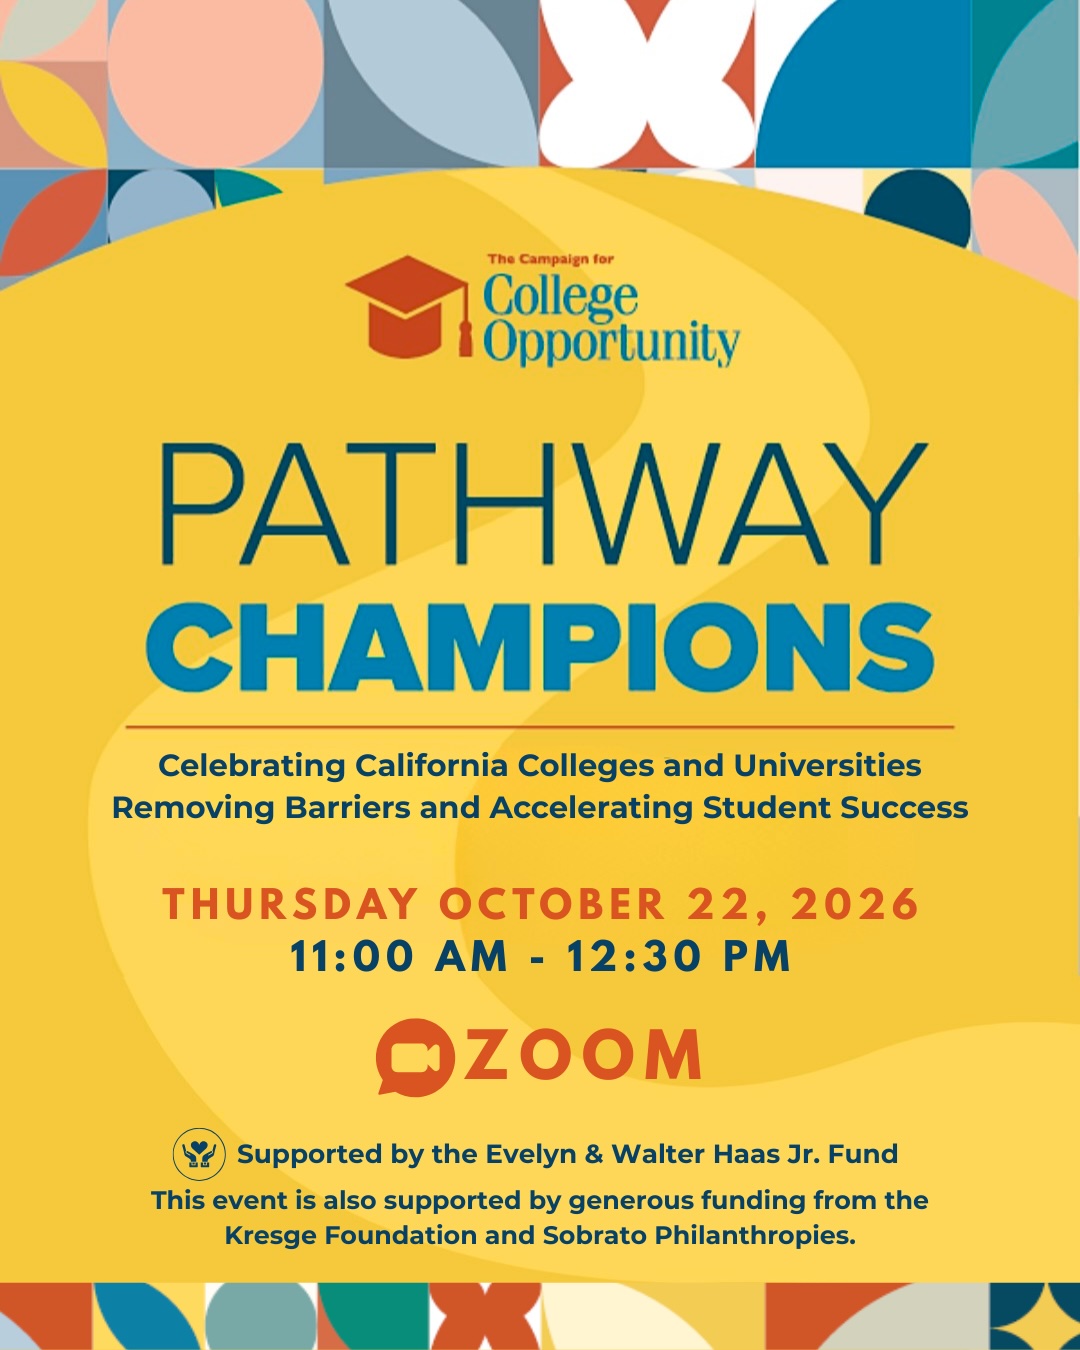
Online celebration Oct. 22

By Juliet V. Casey, Director of Marketing and Media Design, Los Medanos College and Loni Swain, Director of Communications, Campaign for College Opportunity

Pittsburg, Calif. – The Campaign for College Opportunity named Los Medanos College a 2026 Pathway Champion of Placement for its Latino Student Success in English. This award recognizes colleges where Latino students are completing transfer-level English at the highest rates, with particular attention to closing racial equity gaps.

“We commend your institution’s commitment to advancing equitable student success and strengthening California’s transfer pathway,” said Jessie Ryan, president of The Campaign for College Opportunity. “This achievement underscores the extraordinary efforts of your faculty and staff to ensure all students, especially those historically underrepresented, have the opportunity to succeed.”

Ryan added that LMC is leading the way, showing what is possible “when equity and excellence go hand in hand.”

LMC will be recognized during the Pathway Champions: Celebrating Colleges Building Seamless Paths to Student Success virtual celebration on Thursday, October 22, 2026, from 11 a.m. to 12:30 p.m., during National Transfer Week.

“Los Medanos College is a culturally rich institution, where more than 45% of the student population identifies as Latinx,” LMC President Ralston said. “We are honored and proud of this recognition.”

Ralston said that as a federally designated Hispanic-Serving Institution, LMC prioritizes improving transfer-level English completion for this population but has not done so in isolation. The college’s Student Equity Plan includes strategies designed to address shared and intersecting barriers to completion of all students, she said.

Morgan Lynn, chair of LMC’s English Department, faculty members have been making student-centered, holistic, and innovative changes to our programming and pedagogy.

“This award is a testament to all of our committed faculty, who have dedicated themselves to truly putting students first,” she said.

LMC Vice President of Instruction A’kilah Smith applauded the English Department for their notable work.

“I’m especially proud of our English faculty and colleagues who have embraced the opportunity to rethink how we support students, remove barriers, and create pathways to early success in college-level English,” Smith said.

Marisa Johnson, director of policy impact for The Campaign for College Opportunity, said LMC’s approach stands out. During the 2023-2024 academic year, LMC’s overall transfer-level English completion rate within one year of initial enrollment was 69.4% and 65.1% among Latino students, below the threshold to qualify for the award. After implementing its equity plan, which includes targeted initiatives, services, guidance and resources, LMC’s completion rate overall and for Latino students both rose to 72%.

“So, this award really represents closing the equity gap for last year’s English gateway courses,” Johnson said.

Rachel Anicetti, LMC dean of Liberal Arts and Sciences, said the award also reflects LMC’s commitment to equity.

“I am incredibly proud for our English faculty and their collaborative investment in professional development, learning communities, and equitable teaching practices,” she said.

Pathway Champion awards honor campuses advancing landmark reforms in equitable placement (AB 705 and 1705, Irwin), which maximize student success in transfer level-courses, and the Associate Degree for Transfer (ADT), which streamlines transfer between community colleges and CSUs. Since the passage of AB 705 and AB 1705 (Irwin), California Community Colleges have made historic progress in ensuring students are placed directly into transfer-level courses.

The Campaign for College Opportunity is recognizing 40 Pathway Champions this year.  The 40 honorees include California Community Colleges and CSU campuses.

Source: The Campaign for College Opportunity

About Los Medanos College (LMC): LMC is one of three colleges in the Contra Costa Community College District serving the East Contra Costa County community. Established in 1974, LMC has earned federal designations as a Minority-Serving and Hispanic-Serving institution. It offers award-winning transfer and career-technical programs, support services, and diverse academic opportunities in an inclusive learning environment. With exceptional educators, innovative curriculum, growing degree and certificate offerings, and state-of-the-art facilities, the college prepares students to succeed in their educational pursuits, in the workforce, and beyond. LMC’s Pittsburg Campus is located on 120 acres bordering Antioch, with an additional education center in Brentwood. For more information visit www.losmedanos.edu.

About the Campaign for College Opportunity: The Campaign for College Opportunity is a coalition representing business, labor, civil rights, religious groups and civic organizations working to ensure that California keeps the promise of college opportunity to California’s next generation of students. The coalition is dedicated to ensuring every Californian can attend and succeed in college, building a stronger future for California’s communities and the students who power them.

Filed Under: East County, Education, Honors & Awards, News

  • 1
  • 2
  • 3
  • …
  • 36
  • Next Page »
RepublicServices-Antioch-ad (1)
Monica's Riverview 10-26 B
Celia's-10-26
Delta-RC-B 07-26
Deer-Valley-Chiro-06-22

Copyright © 2026 · · Contra Costa Herald · All Rights Reserved